M051959–1961 · Pressure and gel in the amoeboid cytoplasm, 1923–1982 · strongly supported
Streaming pressure and viscosity measured in moving amoebae
Around 1960 two studies put the first numbers on the gel-tube model of amoeboid movement (M04). A counter-pressure of about 1 cm of water (≈108 Pa) stopped streaming in a pseudopod of the giant amoeba Chaos chaos (Allen and Roslansky, 1959), the earliest direct pressure measurement in an amoeba we found, and the viscosity of the endoplasm, the fluid inner cytoplasm, changed with the rate of flow (Yagi, 1961). That the endoplasm does not behave as a simple fluid is strongly supported; the pressure values are single, model-dependent estimates from few cells (proposed). Whether pressure drives cytoplasmic streaming stayed disputed.
Before
By 1947 most authors attributed amoeboid movement to contraction of the outer gel pushing the fluid endoplasm forward, but the nature of the contraction was disputed (De Bruyn, 1947), and even in 1961 none of the competing theories rested on quantitative observations (Yagi, 1961). The one direct force measurement had been made in a slime mold: the air pressure needed to hold still the back-and-forth streaming in a strand of Physarum oscillated, usually within ±20 cm of water (Kamiya, 1940). Earlier viscosity estimates differed widely (Pantin, 1924; Allen and Roslansky, 1959).
What was done
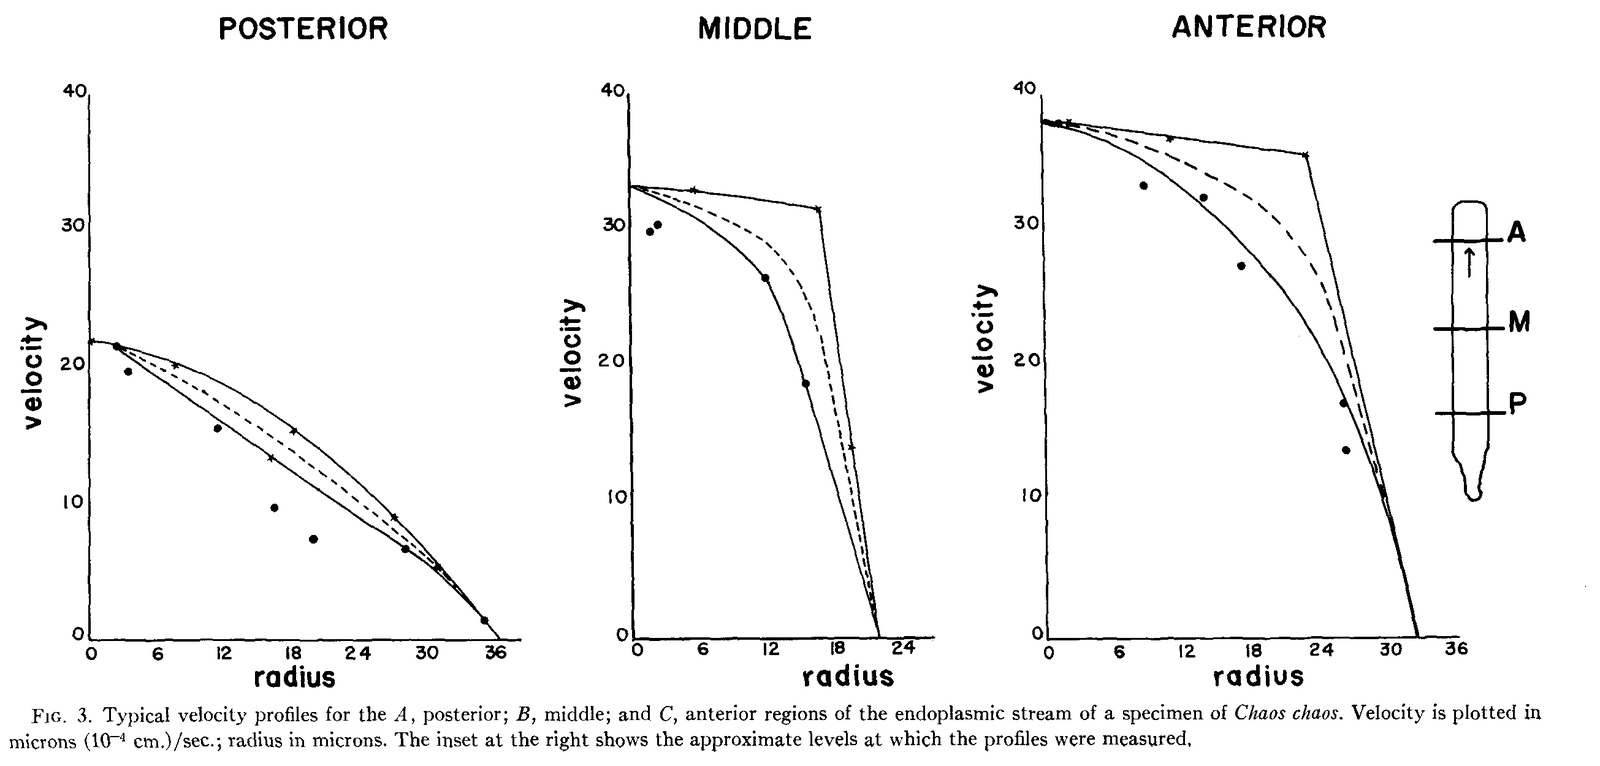
Allen and Roslansky (1959) used three approaches on Chaos chaos. Tracking inclusions, they found that the endoplasm at the front moved almost as a plug, slowing steeply only near the wall, instead of with the parabolic profile of a simple fluid pushed through a tube (figure). Adapting Kamiya’s method, they let advancing pseudopods seal themselves into glass capillaries 80–110 µm wide and raised the gas pressure until streaming stopped, at a minimum of 1.10 cm of water. Suction through one pseudopod of a cell with three or four had “virtually no effect” on the others a few hundred micrometers away, although an open channel of endoplasm joined them (Allen and Roslansky, 1959, p. 442).
If pressure drives the flow, the authors reasoned, the endoplasm must be non-Newtonian, its apparent viscosity depending on how fast it is sheared: a weak gel whose yield point, the stress below which it does not flow, would explain the plug. But they did not assume pressure, because a contraction just behind the hyaline cap would look the same from outside the cell.
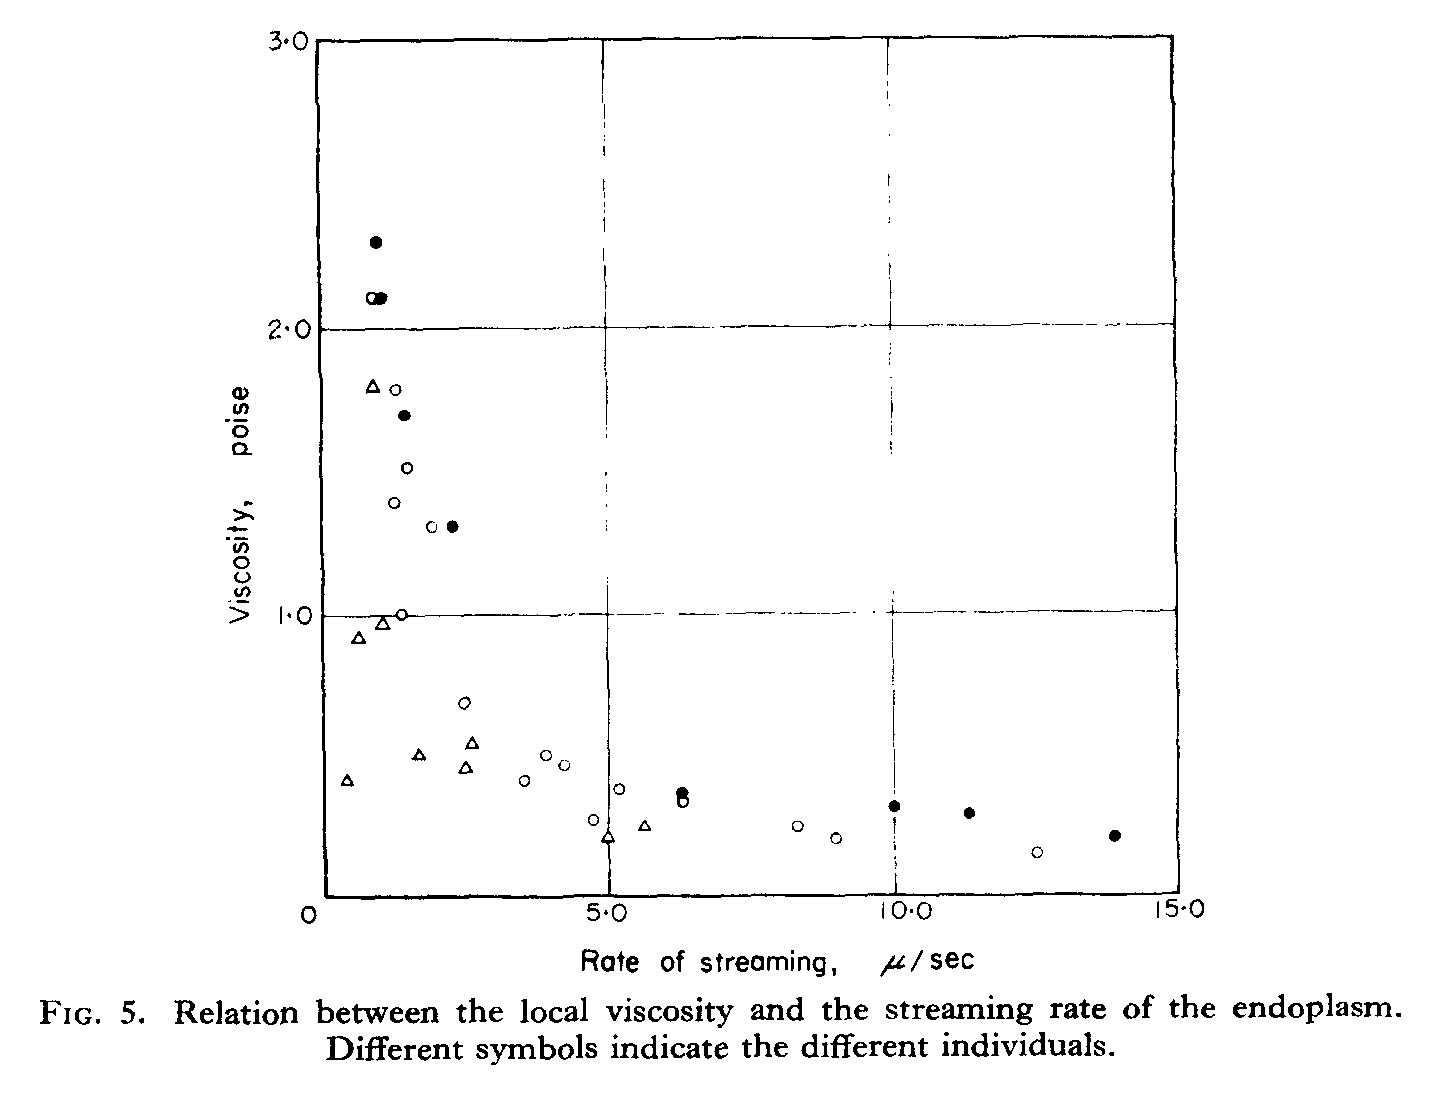
Yagi (1961) measured viscosity directly, pulling ingested nickel particles with a calibrated electromagnet in amoebae confined in glass capillaries. The viscosity, about 0.1–3 poise, fell as the local rate of streaming rose (figure). Treating the stream as Poiseuille flow, steady viscous flow through a rigid tube, he computed front-to-rear pressure differences of about 3–12 Pa, and he concluded that local changes of viscosity matter and that swelling at the rear, with uptake of water, pushes the fluid forward.
| Quantity | Value (SI conversions ours; 1 cm H₂O ≈ 98 Pa, 1 poise = 0.1 Pa·s) | System | Source |
|---|---|---|---|
| Minimum pressure halting streaming | 1.10 cm H₂O (≈108 Pa) over a 0.194 cm pseudopod; range ≈108–314 Pa; n not stated | Chaos chaos, pseudopod sealed in a capillary, counter-pressure | Allen and Roslansky, 1959 |
| Suction without effect on distant pseudopods | up to 6 cm H₂O (≈590 Pa); n not stated | C. chaos with 3–4 pseudopods | Allen and Roslansky, 1959 |
| Endoplasmic viscosity | about 0.1–3 poise (0.01–0.3 Pa·s); 3 cells | Amoeba in capillary, magnetic particle pulling | Yagi, 1961 |
| Front-to-rear pressure difference | 6.4 Pa in one cell (8 measurements; error type not stated); 2.9–11.5 Pa across six cells | as above, computed from viscosity and speed | Yagi, 1961 |
| Ectoplasmic contraction rate | rear 5.4 ± 2.1, middle 1.8 ± 0.91, front 2.6 ± 1.2 %/s (mean ± s.d.; 99, 84, 83 measurements) | moving Amoeba | Yagi, 1961 |
What it changed
The numbers gave the debate units but not a verdict. Yagi (1961) judged the Chaos value higher than his own because a counter-pressure test measures the largest force the protoplasm can exert, not its working pressure. Allen (1961) moved the motor to the front, proposing that the endoplasm contracts in the ‘fountain zone’ at the tip and pulls itself forward (tail versus frontal contraction), since cytoplasm from ruptured Chaos kept streaming for 10 min to 1 h without a membrane or an ectoplasmic tube.
Pressure inside amoebae was measured much later. With servo-null micropipettes, which read pressure by balancing it, Yanai et al. (1996) found that pressure in A. proteus rose while the cell was still, peaked 75 ± 50 s before a pseudopod formed and fell during protrusion, within about 0.2–1.4 kPa. The rate of protrusion rose with the pressure at onset (r = 0.69, 8 pseudopods), but only 6 of about 100 punctured cells gave usable records, and the link is a correlation without perturbation. Blebs, used as pressure gauges with an assumed cytoplasmic stiffness, later gave 45–300 Pa in metaphase HeLa cells (Charras et al., 2008).
Later work and open questions
In our synthesis, the numbers measure different things and need not conflict: a halting counter-pressure (108–314 Pa), a computed front-to-rear difference (3–12 Pa) and an intracellular excess pressure (about 0.2–1.4 kPa). Yagi’s pressure, computed as viscosity times speed, restates the inverse relation between the two (his Fig. 5) rather than measuring pressure independently, and Poiseuille’s law assumes the parabolic profile that Chaos, a different species, did not show (our reading). The nature of the endoplasm is itself disputed: Allen (1960), with a centrifuge microscope, found a structured material with a yield point, and Yagi (1961) a purely viscous one, by different methods in different species.
Why suction did not spread between the pseudopods of Chaos has not been tested. Pressure may spread slowly through a porous, poroelastic cytoplasm, as shown in mammalian cells (Moeendarbary et al., 2013), the endoplasm may have a yield stress (Allen, 1960), or force may be generated locally, as proposed for slime molds (Stewart and Stewart, 1959) and amoebae (Allen, 1961). Whether pressure is uniform in a moving amoeba is also unknown, because intracellular records come from one site per cell (open question); the same question later became central to the physics of blebs (M12).
References (11)
- Allen RD (1960) The consistency of ameba cytoplasm and its bearing on the mechanism of ameboid movement. II. The effects of centrifugal acceleration observed in the centrifuge microscope. J Biophys Biochem Cytol 8:379–397. doi:10.1083/jcb.8.2.379
- Allen RD (1961) A new theory of ameboid movement and protoplasmic streaming. Exp Cell Res Suppl 8:17–31. doi:10.1016/0014-4827(61)90337-8
- Allen RD, Roslansky JD (1959) The consistency of ameba cytoplasm and its bearing on the mechanism of ameboid movement. I. An analysis of endoplasmic velocity profiles of Chaos chaos (L.). J Biophys Biochem Cytol 6:437–446. doi:10.1083/jcb.6.3.437
- Charras GT, Coughlin M, Mitchison TJ et al. (2008) Life and times of a cellular bleb. Biophys J 94:1836–1853. doi:10.1529/biophysj.107.113605
- De Bruyn PPH (1947) Theories of amoeboid movement. Q Rev Biol 22:1–24. doi:10.1086/395577
- Kamiya N (1940) The control of protoplasmic streaming. Science 92:462–463. doi:10.1126/science.92.2394.462
- Moeendarbary E, Valon L, Fritzsche M et al. (2013) The cytoplasm of living cells behaves as a poroelastic material. Nat Mater 12:253–261. doi:10.1038/nmat3517
- Pantin CFA (1924) On the physiology of amoeboid movement. II. The effect of temperature. Br J Exp Biol 1:519–538. doi:10.1242/jeb.1.4.519
- Stewart PA, Stewart BT (1959) Protoplasmic movement in slime mold plasmodia: the diffusion drag force hypothesis. Exp Cell Res 17:44–58. doi:10.1016/0014-4827(59)90151-X
- Yagi K (1961) The mechanical and colloidal properties of Amoeba protoplasm and their relations to the mechanism of amoeboid movement. Comp Biochem Physiol 3:73–91. doi:10.1016/0010-406X(61)90134-7
- Yanai M, Kenyon CM, Butler JP et al. (1996) Intracellular pressure is a motive force for cell motion in Amoeba proteus. Cell Motil Cytoskeleton 33:22–29. doi:10.1002/(SICI)1097-0169(1996)33:1<22::AID-CM3>3.0.CO;2-K